Experiment Configuration user interface
Experiment Configuration widget a.k.a. expconf is a complete interface to
define the experiment configuration. It consists of three main groups of
parameters organized in tabs:
Measurement group
Snapshot group
Storage
The widget can be used in either view mode (default one) or edit mode.
In the view mode the experiment configuration can be only viewed but not edited.
In this mode all the external changes to the experiment configuration
e.g. set_meas macro execution changed
the active measurement group, will be automatically reflected by the widget.
In the edit mode the experiment configuration can be both viewed and edited. In this mode all the external changes to the experiment configuration raise a pop-up dialog asking what to do with the remote changes. In this mode parameters may be modified in an arbitrary order, at any of the tabs, and will be maintained as pending to apply until either applied or reset by the user.
This widget is usually present in sardana-aware Taurus GUIs and is also invoked
by the expconf command in Spock.
Measurement group configuration
In the measurement group tab the user can:
create or remove a measurement group
select the active measurement group
add or remove channels of the measurement group
reorganize the order of the channels in the measurement group
change configuration of a particular channel (or its controller) in the selected measurement group
show/hide online plots for the current scan.
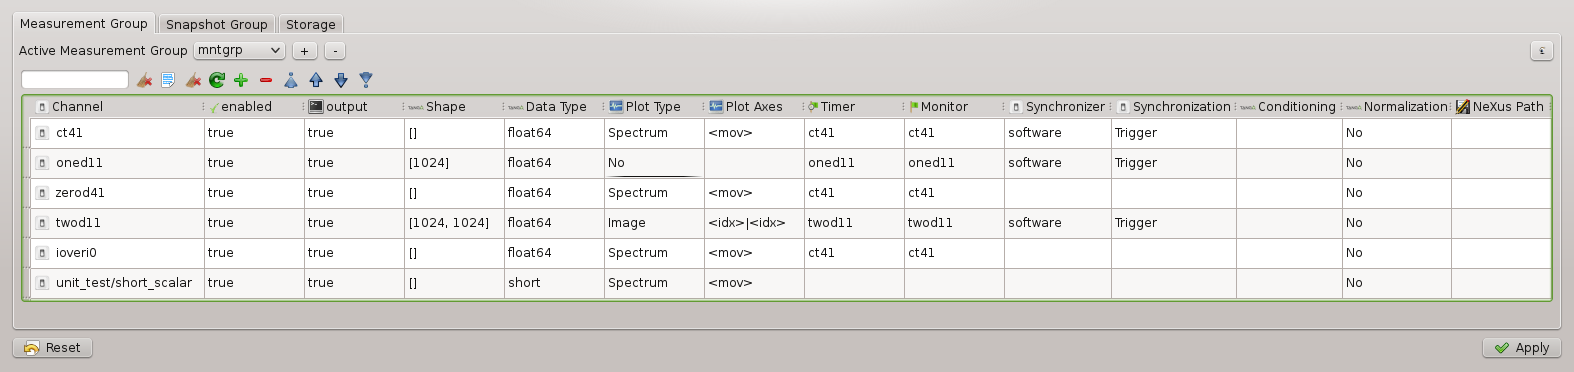
Measurement group tab of the expconf widget with the mntgrp configuration.
Note
In the column Channel, a red icon will appear if the state of the channel is Fault or the channel’s controller is offline.
Experimental channel configuration
In the measurement group table the user can modify the following parameters of a given channel or its controller:
Enabled: include or exclude (True or False) the channel in the acquisition process.
Output: whether the channel acquisition results should be printed, for example, by the output recorder during the scan. Can be either True or False.
Data type: type of the data
Plot type: select the online scan plot type for the channel. Can have one of the following values:
No: no plot
Spectrum: suitable for scalar values
Image: suitable for spectrum values
Plot axes: select the abscissa (x axis) of the plot. Can be either
<idx>: scan index (point number)
<mov>: master moveable (in case of a2scan - the first motor) used in the scan
any of the scalar experimental channels used in the measurement group
Timer: channel to be used as timer. Timer controls the acqusition in terms of the integration time. Applies on the controller level.
Monitor: channel to be used as monitor. Monitor controls the acquisition in terms of the monitor counts. Applies on the controller level.
Synchronizer: the element that will synchronize the channel’s acquisition. Can be either a Trigger/Gate element or the software synchronizer. Configurable only for the timerable controllers. Applies on the controller level.
Synchronization: the synchronization type. Can be either Trigger or Gate. Configurable only for the timerable controllers. Applies on the controller level.
Ref enabled: Enable the referable capability of an experimental channel that allows it.
Ref pattern: If Ref enabled is True, a string used by the referable experimental channel to know where to store data.
Conditioning: expression to evaluate on the data before displaying it
Normalization: normalization mode for the data
Nexus path: location of the data of this channel withing the NeXus tree
View current scan plot(s)
Plots need to be configured previously as explained in the channel configuration (plot type and plot axes). Running a scan will spawn a panel on taurusgui with the plot. The number of panels that will spawn is defined in the channel configuration.
If the configuration hasn’t been changed, a new scan will overwrite the previous plots.
Plots can also be seen with spock’s command showscan online.
Snapshot group
You can configure the snapshot group with the Experiment Configuration widget. To do so, go to the Snapshot Group tab.
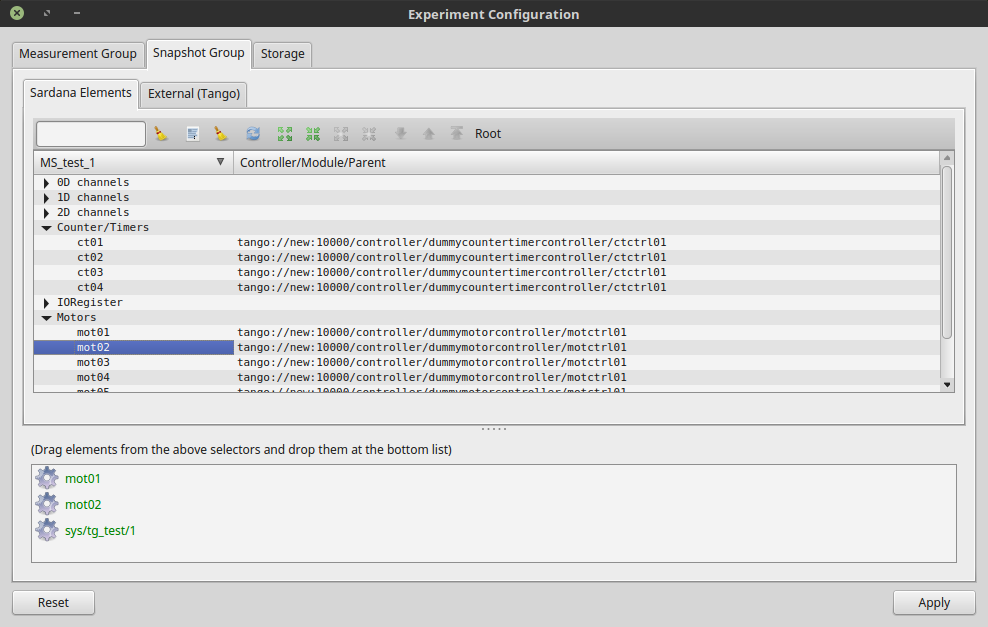
Snapshot Group tab.
This tab provides the device tree browser for both Sardana elements and external devices (currently only Tango is supported as an external source). You can add elements to the snapshot group by just dragging them from the tree browser and dropping them onto the list below.
Note
Settings in this tab alter PreScanSnapshot environment variable.
Storage
The expconf widget provides a way to configure the scan storage paths.
These settings are in the Storage tab.
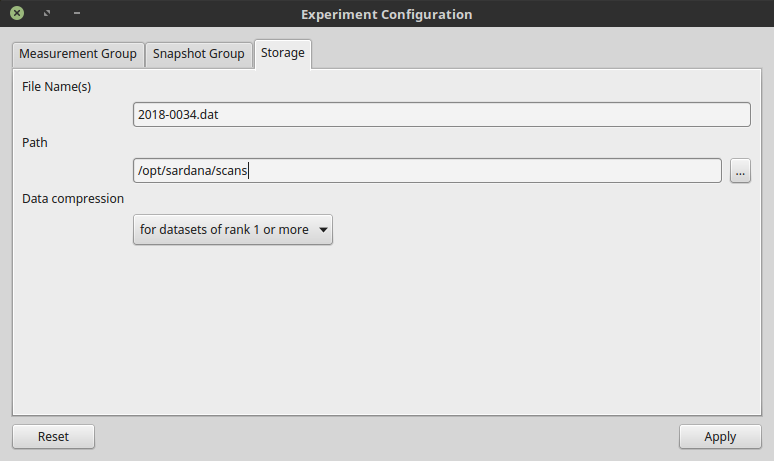
Storage configuration tab.
You can specify multiple files as a comma-separated list. Remeber that the path you set is a path on Sardana server machine.
Note
Settings in this tab alter ScanFile, ScanDir and DataCompressionRank environment variables.